Showing posts with label learning. Show all posts

Wednesday, August 26, 2020

Jupyter: JUlia PYThon and R

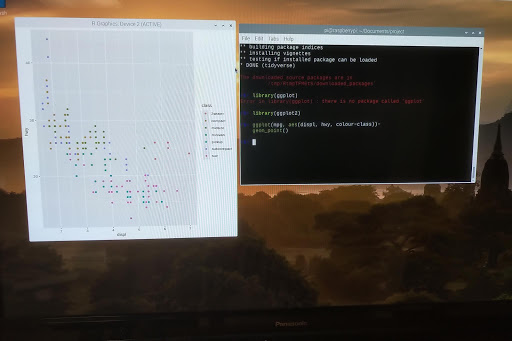
it's "ggplot2", not "ggplot", but it is ggplot()


Did you know that @projectJupyter's Jupyter Notebook (and JupyterLab) name came from combining 3 programming languages: JUlia, PYThon and R.

Readers of my blog do not need an introduction to Python. But what about the other 2?  

Today we will talk about R. Actually, R and Python, on the Raspberry Pi.

R Origin

R traces its origins to the S statistical programming language, developed in the 1970s at Bell Labs by John M. Chambers. He is also the author of books such as Computational Methods for Data Analysis (1977) and Graphical Methods for Data Analysis (1983). R is an open source implementation of that statistical language. It is compatible with S but also has enhancements over the original.


A quick getting started guide is available here: https://support.rstudio.com/hc/en-us/sections/200271437-Getting-Started


Installing Python

As a recap, in case you don't have Python 3 and a few basic modules, the installation goes as follow (open a terminal window first):


pi@raspberrypi: $ sudo apt install python3 python3-dev build-essential

pi@raspberrypi: $ sudo pip3 install jedi pandas numpy


Installing R

Installing R is equally easy:


pi@raspberrypi: $ sudo apt install r-recommended


We also need to install a few development packages:


pi@raspberrypi: $ sudo apt install libffi-dev libcurl4-openssl-dev libxml2-dev


This will allow us to install many packages in R. Now that R is installed, we can start it:


pi@raspberrypi: $ R

Installing packages

Once inside R, we can install packages using install.packages('name') where name is the name of the package. For example, to install ggplot2 (to install tidyverse, simply replace ggplot2 with tidyverse):

> install.packages('ggplot2')


To load it:


> library(ggplot2)

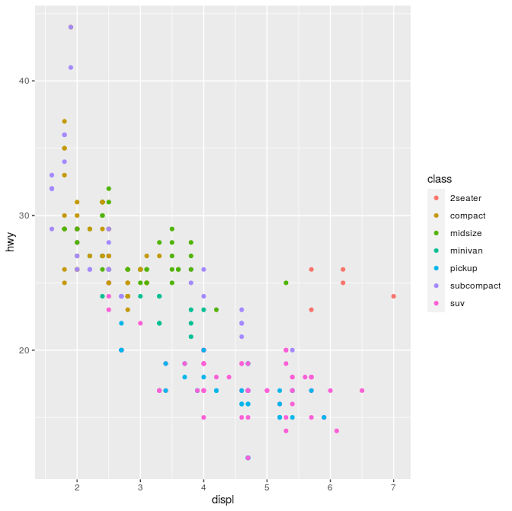
And we can now use it. We will use the mpg dataset and plot displacement vs highway miles per gallon and set the color to:

>ggplot(mpg, aes(displ, hwy, colour=class))+

 geom_point()


Combining R and Python

We can go at this 2 ways, from Python call R, or from R call Python. Here, from R we will call Python.

First, we need to install reticulate (the package that interfaces with Python):

> install.packages('reticulate')

And load it:

> library(reticulate)

We can verify which python binary that reticulate is using:

> py_config()

 Then we can use it to execute some python code. For example, to import the os module and use os.listdir(), from R we do ($ works a bit in a similar fashion to Python's .):

> os <- import("os")
> os$listdir(".")

Or even enter a Python REPL:

> repl_python()
>>> import pandas as pd

>>>


Type exit to leave the Python REPL.

One more trick: Radian

we will now exit R (quit()) and install radian, a command line REPL for R that is fully aware of the reticulate and Python integration:

pi@raspberrypi: $ sudo pip3 install radian


pi@raspberrypi: $ radian

This is just like the R REPL, only better. And you can switch to python very quickly by typing ~:

r$> ~

As soon as the ~ is typed, radian enters the python mode by itself:

r$> reticulate::repl_python()

>>> 

Hitting backspace at the beginning of the line switches back to the R REPL:

r$> 


I'll cover more functionality in a future post.


Francois Dion

Friday, August 11, 2017

Readings in Visualization

"Ex-Libris" part V: Visualization


Part 5 of my "ex-libris" of a Data Scientist is now available. This one is about visualization.

Starting from a historical perspective, particularly of statistical visualization, and covering a few classic must have books, the article then goes on to cover graphic design, cartography, information architecture and design and concludes with many recent books on information visualization (specific Python and R books to create these were listed in part IV of this series). In all, about 66 books on the subject.

Just follow the link to the LinkedIn post to go directly to it:


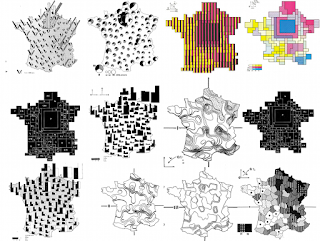
From Jacques Bertin’s Semiology of Graphics

"Le plus court croquis m'en dit plus long qu'un long rapport", Napoleon Ier

See also

Part I was on "data and databases": "ex-libris" of a Data Scientist - Part i
Part II, was on "models": "ex-libris" of a Data Scientist - Part II

Part III, was on "technology": "ex-libris" of a Data Scientist - Part III
Part IV, was on "code": "ex-libris" of a Data Scientist - Part IV
Part VI will be on communication. Bonus after that will be on management / leadership.
Francois Dion
@f_dion

P.S.
Je vais aussi avoir une liste de publications en francais
En el futuro cercano voy a hacer una lista en espanol tambien

Tuesday, June 13, 2017

Readings in Programming

"Ex-Libris" part IV: Code


I've made available part 4 of my "ex-libris" of a Data Scientist. This one is about code. 

No doubt, many have been waiting for the list that is most related to Python.  In a recent poll by KDNuggets, the top tool used for analytics, data science and machine learning by respondents turned out to also be a programming language: Python.

The article goes from algorithms and theory, to approaches, to the top languages for data science, and more. In all, almost 80 books in just that part 4 alone. It can be found on LinkedIn:

"ex-libris" of a Data Scientist - Part IV

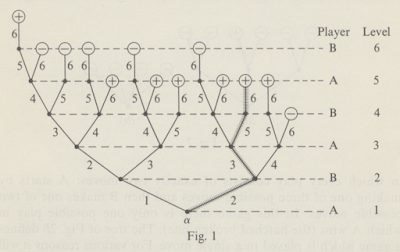
from Algorithms and Automatic Computing Machinesby B. A. Trakhtenbrot


See also


Part I was on "data and databases": "ex-libris" of a Data Scientist - Part i

Part II, was on "models": "ex-libris" of a Data Scientist - Part II


Part III, was on "technology": "ex-libris" of a Data Scientist - Part III

Part V will be on visualization, part VI on communication. Bonus after that will be on management / leadership.

Francois Dion
@f_dion

P.S.
Je vais aussi avoir une liste de publications en francais
En el futuro cercano voy a hacer una lista en espanol tambien

Thursday, April 13, 2017

Readings in data and databases

Recent readings (can you guess/decipher some of them?)

I've been fairly quiet on this particular blog this year. Beside a lot of data science work, I've done presentations at meetups and conferences, including a recent tutorial on "Getting to know your data at scale" at the IEEE SouthEastCon 2017. Notebooks will be posted on github soon.

But, in the meantime...

Ex-libris

Something else I've been doing is publishing a few articles here and there. Just recently, I started a 6 part series on LinkedIn called "ex-libris" of a Data Scientist. I think many readers of this blog will appreciate this series, and particularly this first installment on "data and databases":

"ex-libris" of a Data Scientist - Part i

It covers a good variety of books on the subject, some pretty much must read for whatever corner of the computer science world you live in. Also of interest will be the Postgres, Hadoop and graph database pointers and a list of over 20 curated must read papers in the field.

Python specific books will show up in part IV.


Francois Dion
@f_dion

Monday, April 18, 2016

Los Alamos 10742: The Making of

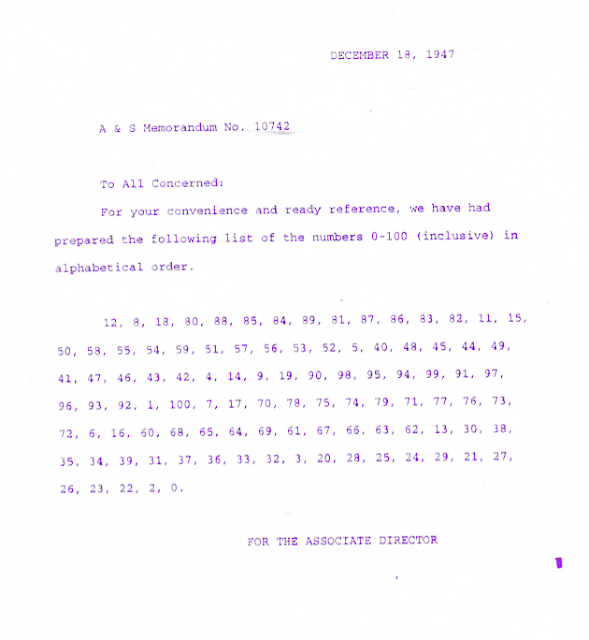
Modern rendering of the original 1947 Memo 10742

Before reading


If you've not read the first part (The return of the Los Alamos Memo 10742) of this blog, go there now. There will be a link to come back here at the end, so you don't forget ...


Your assignment


If you remember, in the previous article, I had asked the students (and, you, the reader) to try this exercise:

"Replicate either:
a) the whole memo
or
b) the list of numbers 
Whichever assignment you choose, the numbers must be generated programmatically."

One possible way

We'll use Python 3 and do b):

In [1]:
def num_to_words(n):
    """Returns a number in words, covering 0 to 100 inclusive."""
    n2w = {
        0: 'zero', 1: 'one', 2: 'two', 3: 'three', 4: 'four', 5: 'five', 6: 'six',
        7: 'seven', 8: 'eight', 9: 'nine', 10: 'ten', 11: 'eleven', 12: 'a dozen',
        13: 'thirteen', 14: 'fourteen', 15: 'fifteen', 16: 'sixteen', 17: 'seventeen',
        18: 'eighteen', 19: 'nineteen', 
        20: 'twenty', 30: 'thirty', 40: 'fourty', 50: 'fifty', 60: 'sixty', 70: 'seventy',
        80: 'eighty', 90: 'ninety', 100: 'one hundred'
    }
    try:
        return n2w[n]
    except KeyError:
        return n2w[n-n%10] + ' ' + n2w[n%10]
The famous twelve as 'a dozen'
In [2]:
num_to_words(12)
Out[2]:
'a dozen'
In [3]:
num_to_words(7)
Out[3]:
'seven'
In [4]:
num_to_words(67)
Out[4]:
'sixty seven'
In [5]:
num_to_words(100)
Out[5]:
'one hundred'
Generating the alphabetical word list, not including number 10
In [6]:
word_tuples = sorted([(num_to_words(num),num) for num in range(101) if num != 10])
Now that the list is sorted alphabetically, just want the second item of each tuple [1]
In [7]:
result = list(zip(*word_tuples))[1]
Let's print this.
In [8]:
print(str(result)[1:-1])
12, 8, 18, 80, 88, 85, 84, 89, 81, 87, 86, 83, 82, 11, 15, 50, 58, 55, 54, 59, 51, 57, 56, 53, 52, 5, 4, 14, 40, 48, 45, 44, 49, 41, 47, 46, 43, 42, 9, 19, 90, 98, 95, 94, 99, 91, 97, 96, 93, 92, 1, 100, 7, 17, 70, 78, 75, 74, 79, 71, 77, 76, 73, 72, 6, 16, 60, 68, 65, 64, 69, 61, 67, 66, 63, 62, 13, 30, 38, 35, 34, 39, 31, 37, 36, 33, 32, 3, 20, 28, 25, 24, 29, 21, 27, 26, 23, 22, 2, 0
In [ ]:

If you read the commentaries for the previous article on the subject, you surely ran into Edward Carney's almost working proposed solution. I am adding it here as another way of attacking the problem. Edward used a module named num2words. As you'll discover over years of writing python code, most anything you can think of has already been done. And in some cases, multiple times.

Why did I say almost working? Let's see if somebody finds the issue. If not I'll post the correction in a future post (the very next one will diverge from this subject to talk about fractals). I'll also introduce the inflect module and since we're introducing some NLP concepts, I'll bring in NLTK too.

In [1]:
import num2words as n2w
In [2]:
key_set = []
[key_set.append(n2w.num2words(i)) for i in list(range(101))]
key_set[12] = 'dozen'
key_set[100] = 'one hundred'
numset_dict = dict(zip(key_set,list(range(101))))
line_breaks = [14, 30, 46, 62, 78, 94]
for i, k in enumerate(yvals):
    print('{} '.format(k[1]),end='')
    if i in line_breaks:
        print('\n')
---------------------------------------------------------------------------
NameError                                 Traceback (most recent call last)
<ipython-input-2-6c7998a49267> in <module>()
      5 numset_dict = dict(zip(key_set,list(range(101))))
      6 line_breaks = [14, 30, 46, 62, 78, 94]
----> 7 for i, k in enumerate(yvals):
      8     print('{} '.format(k[1]),end='')
      9     if i in line_breaks:

NameError: name 'yvals' is not defined


You know the solution? Post it in the comments section.

Francois Dion
@f_dion

Saturday, March 5, 2016

The return of the Los Alamos Memo 10742 -

Modern rendering of the original 1947 Memo 10742

The mathematician prankster


Can you imagine yourself receiving this memo in your inbox in Washington in 1947? There's a certain artistic je ne sais quoi in this memo...

This prank was made by J Carson Mark and Stan Ulam.  A&S was Administration and Services.

And Ulam, well known for working on the Manhattan project, also worked on really interesting things in mathematics. Specifically, a collaboration with Nicholas Constantine Metropolis and John Von Neumann. You might know this as the Monte Carlo method (so named due to Ulam's uncle always asking for money to go and gamble in a Monte Carlo casino...). Some people have learned about a specific Monte Carlo simulation (the first) known as Buffon's needle.

Copying the prankster

When I stumbled upon this many years ago, I decided that it would make a fantastic programming challenge for a workshop and/or class. I first tried it in a Java class, but people didn't get quite into it. Many years later I redid it as part of a weekly Python class I was teaching at a previous employer.

The document is the output of a Python script. In order to make the memo look like it came from the era, I photocopied it. It still didn't look quite right, so I then scanned that into Gimp, bumped the Red and Blue in the color balance tool to give it that stencil / mimeograph / ditto look.


Your assignment


Here is what I asked the students:

"Replicate either:
a) the whole memo
or
b) the list of numbers 
Whichever assignment you choose, the numbers must be generated programmatically."

That was basically it. So, go ahead and try it. In Python. Or in R, or whatever you fancy and post a solution as a comment.

We will come back in some days (so everybody gets a chance to try it) and present some possible methods of doing this. Oh, and why the title of "the return of the Los Alamos Memo"? Well, I noticed I had blogged about it before some years back, but never detailed it...

Learning more on Stan Ulam


See the wikipedia entry and also:

LOS ALAMOS SCIENCE NO. 15, 1987


[EDIT: Part 2 is at: los-alamos-10742-making-of.html]

Francois Dion
@f_dion

Friday, January 2, 2015

Innovation is not a hotdog

Once upon a time


You would walk in a supermarket, buy hot dogs and hot dog buns. It was a pretty straightforward process. Sausage pack, check. Buns, check.

Then, someone had the idea of making a bun length sausage. Hmm, ok, except that different brand of "bun length" sausages and buns all have different metrics. But hey, that's ok, it was a valiant effort.

More is more


Some time passed, and somebody thought, "hey, let's make a sausage longer than the bun!". Of course, all readers will be quick to point out that there never was a sausage exactly the length of a bun, they were either slightly shorter, or slightly longer. It was just a "more is more" marketing.

What's next


You are probably expecting a sausage to appear on the market "shorter than the bun!". And the circle will be complete. But, which one is the better design? Which one innovates? Same answer to both question: the original design for sausage, which dates back to at least the 9th century BC. Anything beyond that is in the presentation (the marketing).

Tech innovation


Now, back to technology. Let's take the phone, for example. Clearly, going wireless was an innovation. Going pocketable was an innovation. Touchscreen. Haptics. Innovations. But the same tech, just in a different (bigger and bigger, a.k.a. "more is more" marketing) package, is not innovation (*cough* apple *cough* samsung). In fact, one could say there is a clear regression in that field (phones used to have battery life expressed in weeks, could fit in your pocket, even in jogging shorts, could be dropped multiple times on rock hard surfaces without any problem etc)

You can do it


So, why am I talking about all of that? Well, it's my yearly encouragement to truly innovate (see last years post here). But you can't do it in a vacuum. Engage in your local community. If you haven't done so yet, make it a goal this year. Your local programing user groups (Python, Java, Javascript, whatever), maker space or hacker space, robotics, raspberry pi or other creative group, you local coworking, STEM/STEAM school groups etc. Not only will you benefit from attending, by growing your network and your knowledge, but you'll contribute something back to your community, to the society.

Before I sign off for the day, do read my post on innovation in general and personal scale innovation from last year.

@f_dion

Monday, February 3, 2014

Python tip[8]

Tip #8

Always use a good bit of data to test your data driven apps. Don't rely only on nose testing. But where to get data? Fake it. Never underestimate the power of import random. But when you need more than numbers:

pip install fake-factory

You can also take a look at faker, faker.py, ForgeryPy (and many more on pypi.python.org). Then there is fake-data-generator. Or if you want a csv or sql, try mockaroo.com

What it does: Although you could use real data, sometimes you don't have any. In fact, more than likely you probably wont be  able to generate a significant amount of data for weeks after going live with your web application. Or perhaps it is a desktop application and you'll never see the generated data. So just fake it. You need volume, and it's easy to create.

Another point to keep in mind is that using real data might be risky, depending on what it is. For sure you do not want real credit card numbers floating around on development instances.


François
@f_dion

Sunday, January 26, 2014

Python tip[7]

Tip #7

Today's tip is quite basic, but will require time and effort to master:

Master the shell environment

What it does: Mac, Windows, Linux, BSD or Unix (or even something else). Whatever your operating system, become really good at using the command line, the shell. Bash, Powershell, ksh93 etc. Learn it. Else, it's like learning a bunch of words in a new language, but never learning the correct constructs. You might be able to communicate, but it'll never be very efficient. So go and find tutorials.

And then find the tools that'll make your life easier.

For example, *nix users, are you familiar with autojump (plus it's written in python)?

Windows users, did you know there is an equivalent Jump-Location for powershell?


François
@f_dion

Saturday, January 25, 2014

How projects nights are enablers for innovation

Project nights


Do you attend project nights organized by your local maker group, hackerspace, python user group, raspberry pi user group or other similar tech meet?

No? Why not, is it because there are none? Suggest it, then. Or perhaps it is because you do not have anything to present, or do not need help with any projects. Having said that...

Innovation

Is not inventing something brand new from scratch. It's about standing on the shoulder of giants (a true, if somewhat overused metaphor). Taking many different things and bringing them together into a coherent entity, either a finished good, a software, a consumable or a building block for something else, in a new, innovative way.

It is not easy to achieve that. Are you familiar with all the bleeding and leading edge stuff happening in the tech space, in you area of expertise? Outside your area of expertise?

By attending project nights, and exchanging with people with different backgrounds and fields of expertise, the probability is much higher that you will come up with a solution, or even a new idea. But, more than that, it's at a personal level that you may benefit...

Personal scale innovation

While we all (well, a majority) would like to create the next big thing that will revolutionize the well being of mankind, truth is, what is more likely is to innovate at a personal level, household level or local community level. And your innovation or discussion may trigger another one, that is, if you are involved in some way in your community.

As an example, PYPTUG had a recent project night. One project was exploring the python picamera module. What started as that ended up creating two new projects, one based on Pi NoIR, the Raspberry Pi camera with no IR, as a way to detect heat loss (we'll see how well that works), and the other, as a helper to solder SMD devices.

Each month, there are many such moments of personal scale innovation. Perhaps not iPhone or Pebble (or Raspberry Pi) worldwide game changing innovation, but personal and local scale innovation.

François
@f_dion

Monday, January 20, 2014

Python tip[6]

Tip #6

Today's tip is in response to a great question on a local Linux user group:

python -m cProfile myscript.py

What it does: It'll give you a breakdown per line of how much time each operation takes to execute. Normally, profiling is best done with something like dtrace, to minimize the impact on the run time, but the original question was about figuring out the time for each operation in a python script running on the Raspberry Pi (no dtrace...).

Assuming the following script (we'll use sleep to simulate different runtime, and not call the same function either, else each would be collased under one line on the report):
from time import sleep

def x():
    sleep(4)

def y():
    sleep(5)

def z():
    sleep(2)

x()
y()
z()
print("outta here")
we get:
python -m cProfile script.py
outta here
         8 function calls in 11.009 seconds

   Ordered by: standard name

   ncalls  tottime  percall  cumtime  percall filename:lineno(function)
        1    0.000    0.000   11.009   11.009 t.py:1(<module>)
        1    0.000    0.000    4.002    4.002 t.py:3(x)
        1    0.000    0.000    5.005    5.005 t.py:6(y)
        1    0.000    0.000    2.002    2.002 t.py:9(z)
        1    0.000    0.000    0.000    0.000 {method 'disable' of '_lsprof.Profiler' objects}
        3   11.009    3.670   11.009    3.670 {time.sleep}


François
@f_dion

Tuesday, January 14, 2014

Python tip[5]

Tip #5


Meet the triumvirate  of python interactive sessions:

help(), dir(), see()

So no doubt you use help, and probably dir, but you are probably wondering about see()... That's because it has to be installed first:

pip install see

What it does: Unless you speak native dunder (double underscore), dir's output can be a little overwhelming. For example, a dir on an int object (everything is an object in python...) gives us:

>>> dir(1)
['__abs__', '__add__', '__and__', '__class__', '__cmp__', '__coerce__', '__delattr__', '__div__', '__divmod__', '__doc__', '__float__', '__floordiv__', '__format__', '__getattribute__', '__getnewargs__', '__hash__', '__hex__', '__index__', '__init__', '__int__', '__invert__', '__long__', '__lshift__', '__mod__', '__mul__', '__neg__', '__new__', '__nonzero__', '__oct__', '__or__', '__pos__', '__pow__', '__radd__', '__rand__', '__rdiv__', '__rdivmod__', '__reduce__', '__reduce_ex__', '__repr__', '__rfloordiv__', '__rlshift__', '__rmod__', '__rmul__', '__ror__', '__rpow__', '__rrshift__', '__rshift__', '__rsub__', '__rtruediv__', '__rxor__', '__setattr__', '__sizeof__', '__str__', '__sub__', '__subclasshook__', '__truediv__', '__trunc__', '__xor__', 'conjugate', 'denominator', 'imag', 'numerator', 'real']


>>> from see import see
>>> see(1)
    +           -           *           /           //          %           **
    <<          >>          &           ^           |           +obj
    -obj        ~           <           <=          ==          !=          >
    >=          abs()       bool()      divmod()    float()     hash()
    help()      hex()       int()       long()      oct()       repr()
    str()       .conjugate()            .denominator            .imag
    .numerator  .real


A little more human readable, no? Oh, I'm about to hear the complaint about typing from see import see everytime you start up python. Time to go and check tip #2...


François
@f_dion

Friday, January 10, 2014

Python tip[4]

Tip #4


I was mentioning cppcheck on twitter, for those of us who also code in C/C++. I must admit I didn't start using it until I saw Alan (Coopersmith) using it on Xorg about a year ago. So, what do we have for python? Today I'll make a quick mention of Pylint. Install is simple, along the line of (adjust to your package manager):

sudo apt-get install pylint

Then you can go into a python project and do:

pylint your_filename.py

What it does: "Pylint is a tool that checks for errors in Python code, tries to enforce a coding standard and looks for bad code smells", according to pylint.org. It also gives your code an overall mark. It's a good idea to at least run it and look at the suggestions it offers.

Bonus: pylint includes pyreverse which allows one to generate a package and class diagram (UML) from source code. This works ok as long as the code is straight forward.


François
@f_dion

Tuesday, January 7, 2014

Python tip[3]

Tip #3

As you install new modules (say, with pip install) to support your Python application, add them to a requirements.txt file and do the same for your tests, as test_requirements.txt. Installation is then a simple:

pip install -r requirements.txt

What it does: It allows you to keep track of what packages are needed if you share your code, deploy it to other machines, or if you somehow have to rebuild your computer. You can also quickly test that the list is up to date by creating a virtualenv --no-site-packages, and then using a pip for that virtual environment to do the install.


François
@f_dion

Wednesday, January 1, 2014

Python tip[2]

Tip #2

In your home directory, in a file named .env.py put the imports you want to always have preloaded in python interactive mode:
from some_module import something
In your .bashrc or .profile, add:
export PYTHONSTARTUP=$HOME/.env.py
What it does: When you login and open a terminal, the environment variable PYTHONSTARTUP will be set, and when you execute python (or bpython, too), the python interpreter will load whatever scripts are in PYTHONSTARTUP and be ready for you to use them without having to type them everytime. In this example, I could use functionality something of some_module right away.


François
@f_dion

Tuesday, December 31, 2013

Python Tip of the [day, week, month]

PTOTD

Starting tomorrow, I'll post a Python tip on a regular basis. I cant promise a PTOTD, but it'll be more often than once a month, so that identifies the boundaries.

Ok, I lied, I'll start with one right now:

Tip #1

python -i script.py
What it does: At the conclusion of the execution of script.py, instead of exiting, the python interpreter stays in interactive mode, with everything ready to be printed or debugged.

François
@f_dion

Thursday, August 22, 2013

From Java to Burma

Hands on Python


This month at our local Python user group (PYPTUG), I'll do a hands on session. Could have been in a workshop, code dojo or project night, but it'll be part of the normal monthly meeting.

Attributes, Properties and Descriptors


A lot of people learned C++ or Java in school and some of the normal patterns for these languages are regularly seen in the wild in languages such as C# and Python. Having coded in all of these, and many more, I appreciate greatly some of the features of a given programming language. And when it comes to Python (as Roger Sessions said, paraphrasing Einstein), that "everything should be as simple as it can be, but no simpler".

 The hands on will focus on attributes, and how to keep it simple. And of course, how to get out of trouble, because you have to do something not so simple later, using properties and descriptors.

I will be posting to my bitbucket pyptug repository some material related to the talk, including a log of the interactive session we will be doing.

Audience will be ranging from people who have never coded, to people who have programmed in other languages, to python experts. I love a challenge.

François
@f_dion

Sunday, August 18, 2013

200000th visitor


Raspberrypi and Python


In February 2013, this blog reached the 100,000th visitor milestone. Tonight, it just past the 200,000th.

This little experiment has been ongoing for almost a year now. As I had mentioned before, I didn't expect a lot of visitors due to the specificity of the blog, but it was something I had to do. Most projects I do for business, I cant talk about, so I've made up some projects specifically for this blog.

The Raspberry Pi has continued on the road to popularity, and this has exposed many people to embedded computing, to software development and electronics, and that is a good thing. Some other subjects that have been popular over the year have been Brython, ZFS and dtrace.

I've seen people I've introduced to the Pi, to electronics or to replicators (ie. CNC, 3D printers, laser cutters), to Python or Brython come up with some really cool stuff in the past year, and that is ultimately quite rewarding.


The visitor 

So, where is this 200,000th visitor from? Surprisingly from the town of Sanford, NC. I say surprisingly because it is only an hour and a half away from Winston Salem by car.

Sanford, NC


François
@f_dion