Description
Pandas version checks
-
I have checked that this issue has not already been reported.
-
I have confirmed this bug exists on the latest version of pandas.
-
I have confirmed this bug exists on the master branch of pandas.
Reproducible Example
import pandas as pd

df = pd.DataFrame(
    {'A': [4, 2, 1, 2, 5, 2]}, index=pd.RangeIndex(6, name='B')
)

df.plot(kind='barh', xlabel='x', ylabel='y')
Issue Description
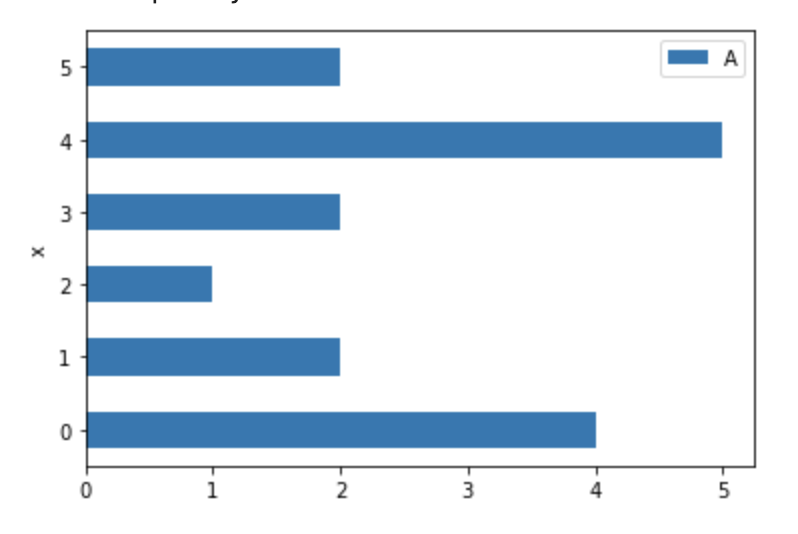
With bar plots, we can pass xlabel and ylabel to plot() and have those values set as the x- and y-axis labels (overriding any defaults). However, if you try this with a barh plot both xlabel and ylabel update the y-axis label, and the only way to update the x-axis label is after the fact with ax.set_xlabel(). Here's the result for the code above:
Expected Behavior
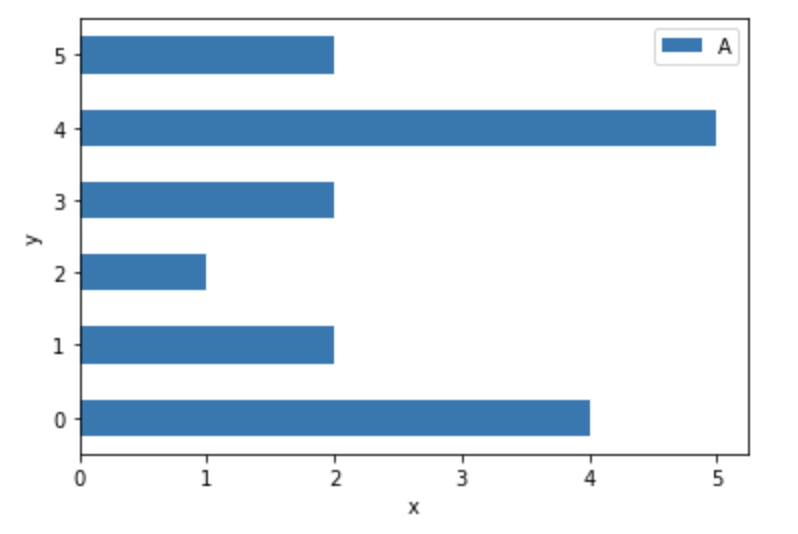
With the code provided above, I would expect this:
In addition, providing only xlabel should label the x-axis only (currently, this updates the y-axis label, which is confusing).
Installed Versions
INSTALLED VERSIONS
commit : 945c9ed
python : 3.9.6.final.0
python-bits : 64
OS : Darwin
OS-release : 19.6.0
Version : Darwin Kernel Version 19.6.0: Thu Sep 16 20:58:47 PDT 2021; root:xnu-6153.141.40.1~1/RELEASE_X86_64
machine : x86_64
processor : i386
byteorder : little
LC_ALL : None
LANG : en_US.UTF-8
LOCALE : en_US.UTF-8
pandas : 1.3.4
numpy : 1.20.3
pytz : 2021.1
dateutil : 2.8.2
pip : 21.2.4
setuptools : 52.0.0.post20210125
Cython : 0.29.25
pytest : 6.2.5
hypothesis : 6.29.3
sphinx : None
blosc : None
feather : None
xlsxwriter : None
lxml.etree : 4.6.3
html5lib : None
pymysql : None
psycopg2 : None
jinja2 : 3.0.2
IPython : 7.29.0
pandas_datareader: 0.10.0
bs4 : None
bottleneck : 1.3.2
fsspec : None
fastparquet : None
gcsfs : None
matplotlib : 3.4.2
numexpr : 2.7.3
odfpy : None
openpyxl : None
pandas_gbq : None
pyarrow : None
pyxlsb : None
s3fs : None
scipy : 1.7.1
sqlalchemy : None
tables : None
tabulate : None
xarray : None
xlrd : None
xlwt : None
numba : None

